Navigating Success Through Informed Insight.
Custom dashboards that visualize KPIs, trends, and performance metrics in real-time.
Efficient data structuring and advanced DAX logic to handle complex business scenarios.
Combine data from Excel, Tally, SQL, APIs, and cloud platforms into one unified view.
Automate report updates and set alerts for threshold breaches and key events.
Secure, user-specific views to ensure sensitive data is shared only with the right users.
Visualize sales performance, lead conversions, campaign ROI, and customer segmentation.
Visualize sales performance, lead conversions, campaign ROI, and customer segmentation.
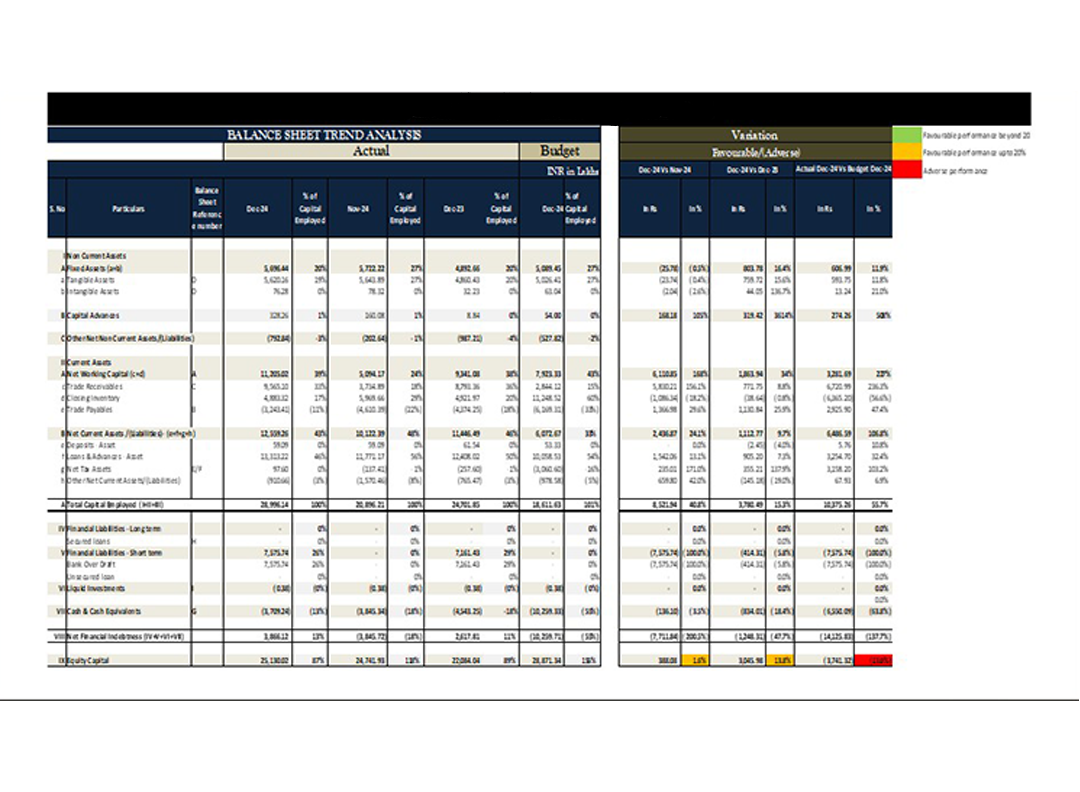
Finance & Tally Integration: Build dashboards from Tally data using Power BI connectors or ODBC, offering real-time insights into receivables, payables, and cash flow.
Finance & Tally Integration: Build dashboards from Tally data using Power BI connectors or ODBC, offering real-time insights into receivables, payables, and cash flow.
Track daily operations, order fulfillment, inventory, and delivery timelines from a centralized Power BI workspace.
Track daily operations, order fulfillment, inventory, and delivery timelines from a centralized Power BI workspace.
Monitor employee performance, attendance, training impact, and departmental KPIs.
Monitor employee performance, attendance, training impact, and departmental KPIs.
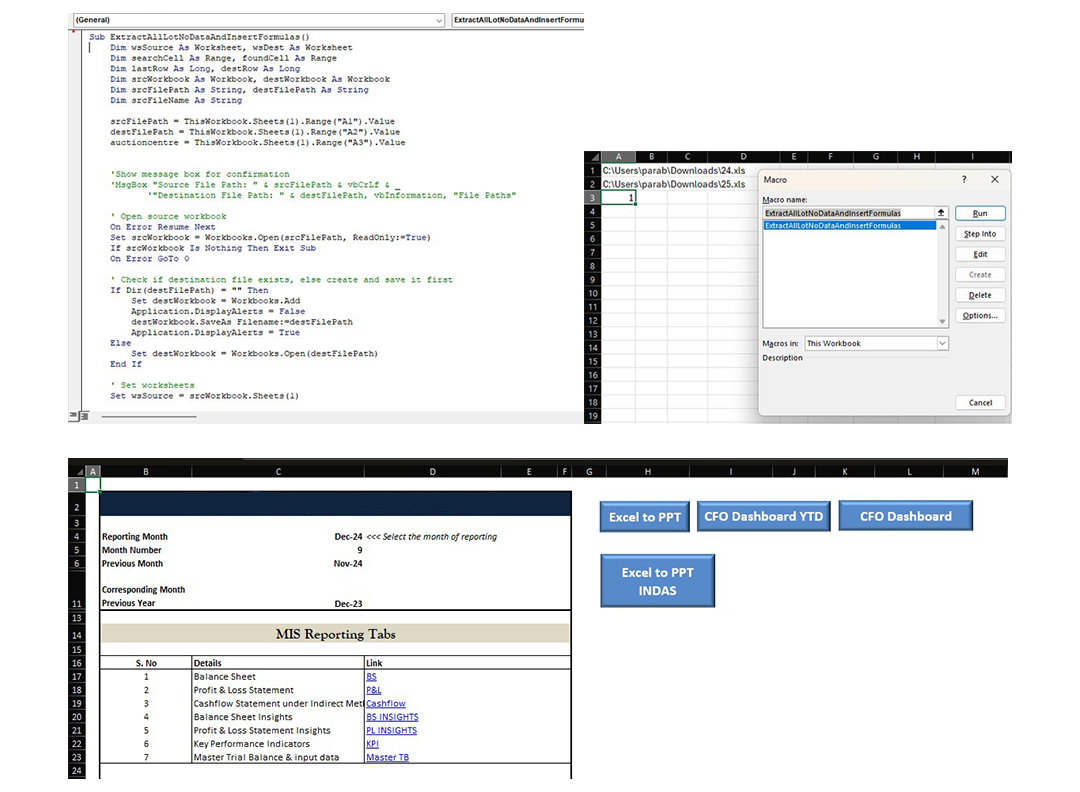
Automatically extract and update Tally data in Excel for GST reports, payables/receivables tracking, and expense monitoring.
Automatically extract and update Tally data in Excel for GST reports, payables/receivables tracking, and expense monitoring.
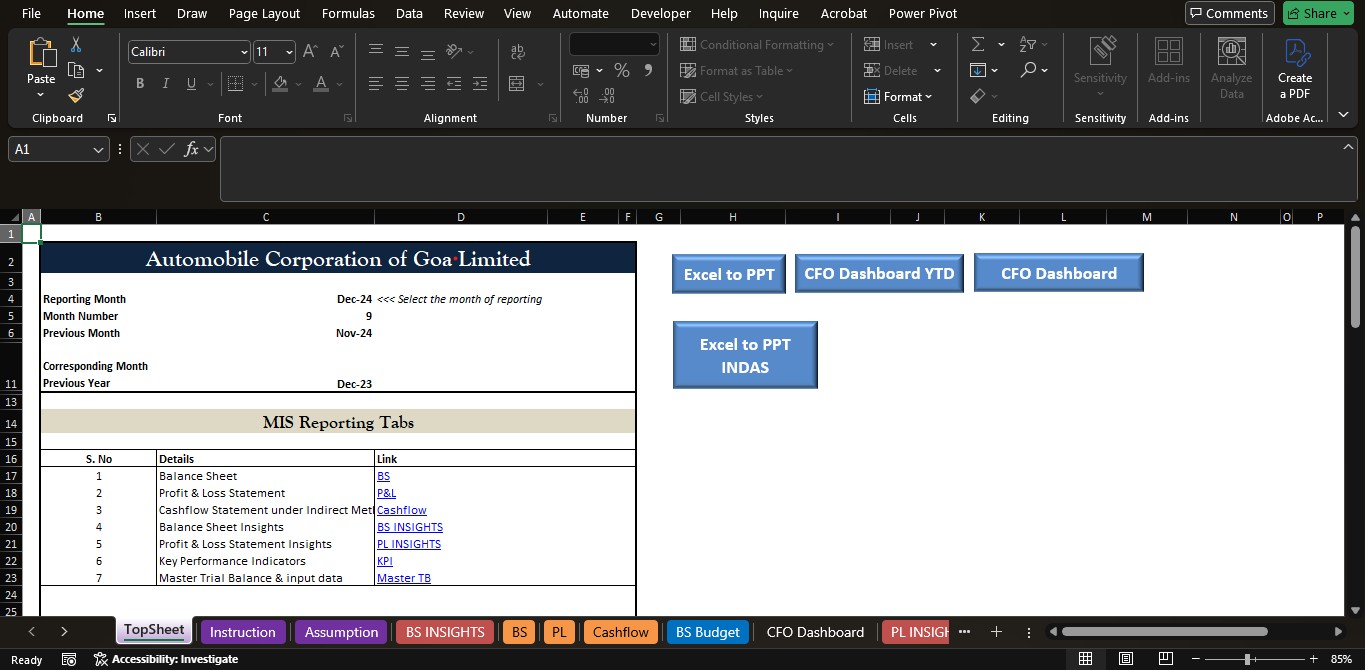
Create up-to-date Excel dashboards reflecting current sales, stock levels, and outstanding balances.
Create up-to-date Excel dashboards reflecting current sales, stock levels, and outstanding balances.
Customized solutions for daily, weekly, and monthly reports tailored to each client's unique business model.
Customized solutions for daily, weekly, and monthly reports tailored to each client's unique business model.